
Meta Platforms, Inc.
Q1 2026 Earnings Review
Advertising AI Flywheel Delivers +33% Top Line; Capex Surge to $135B Midpoint Tests Investor Conviction
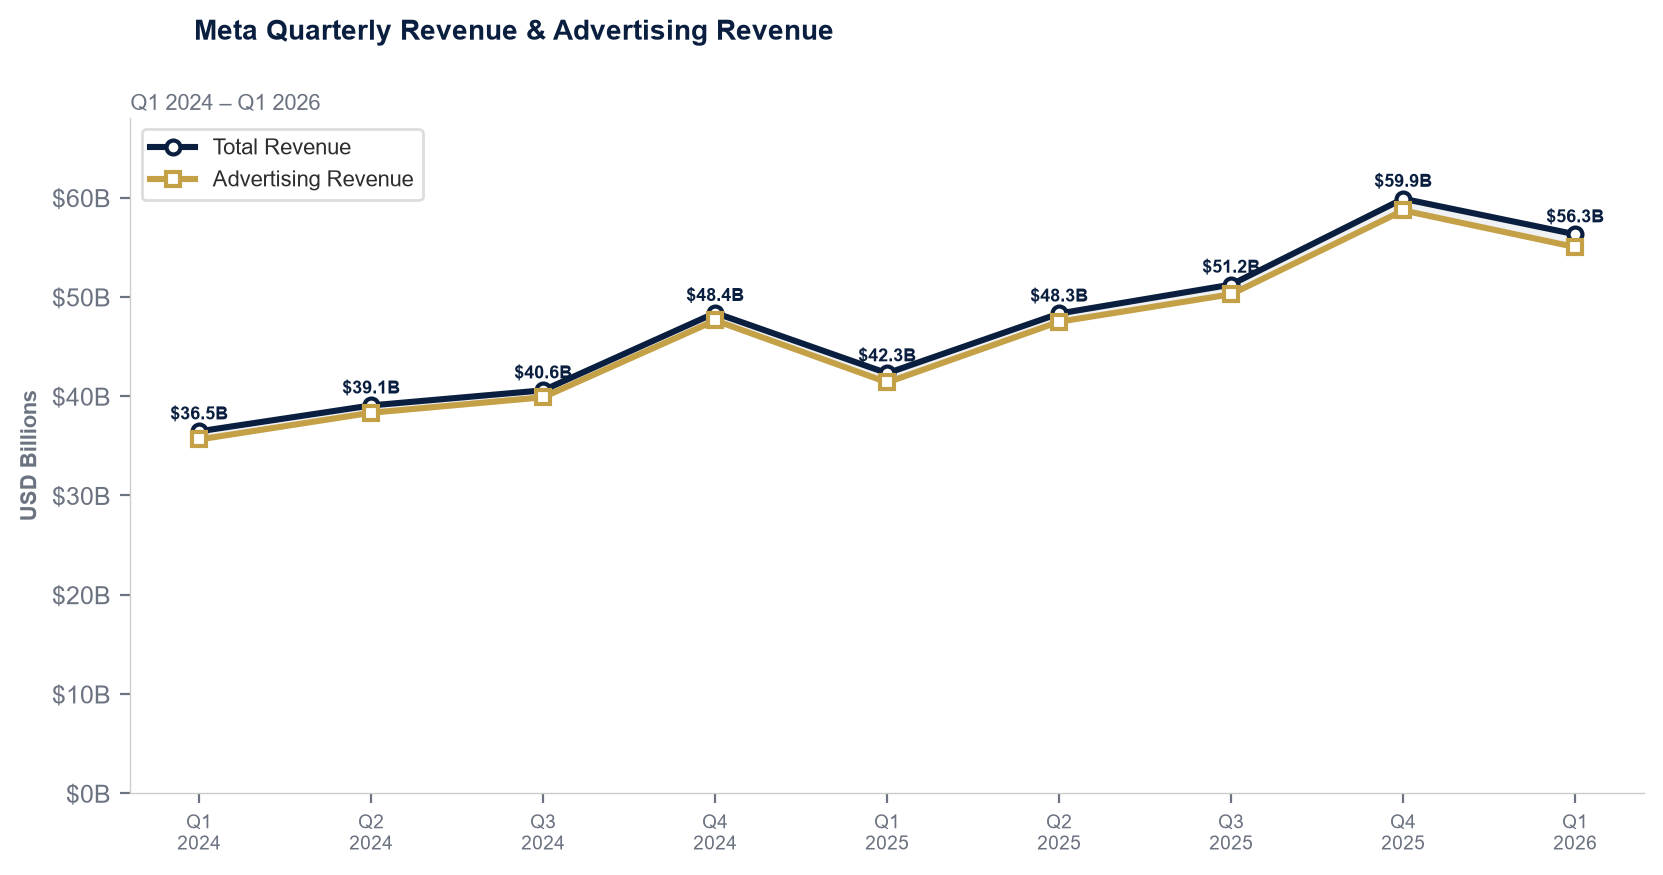
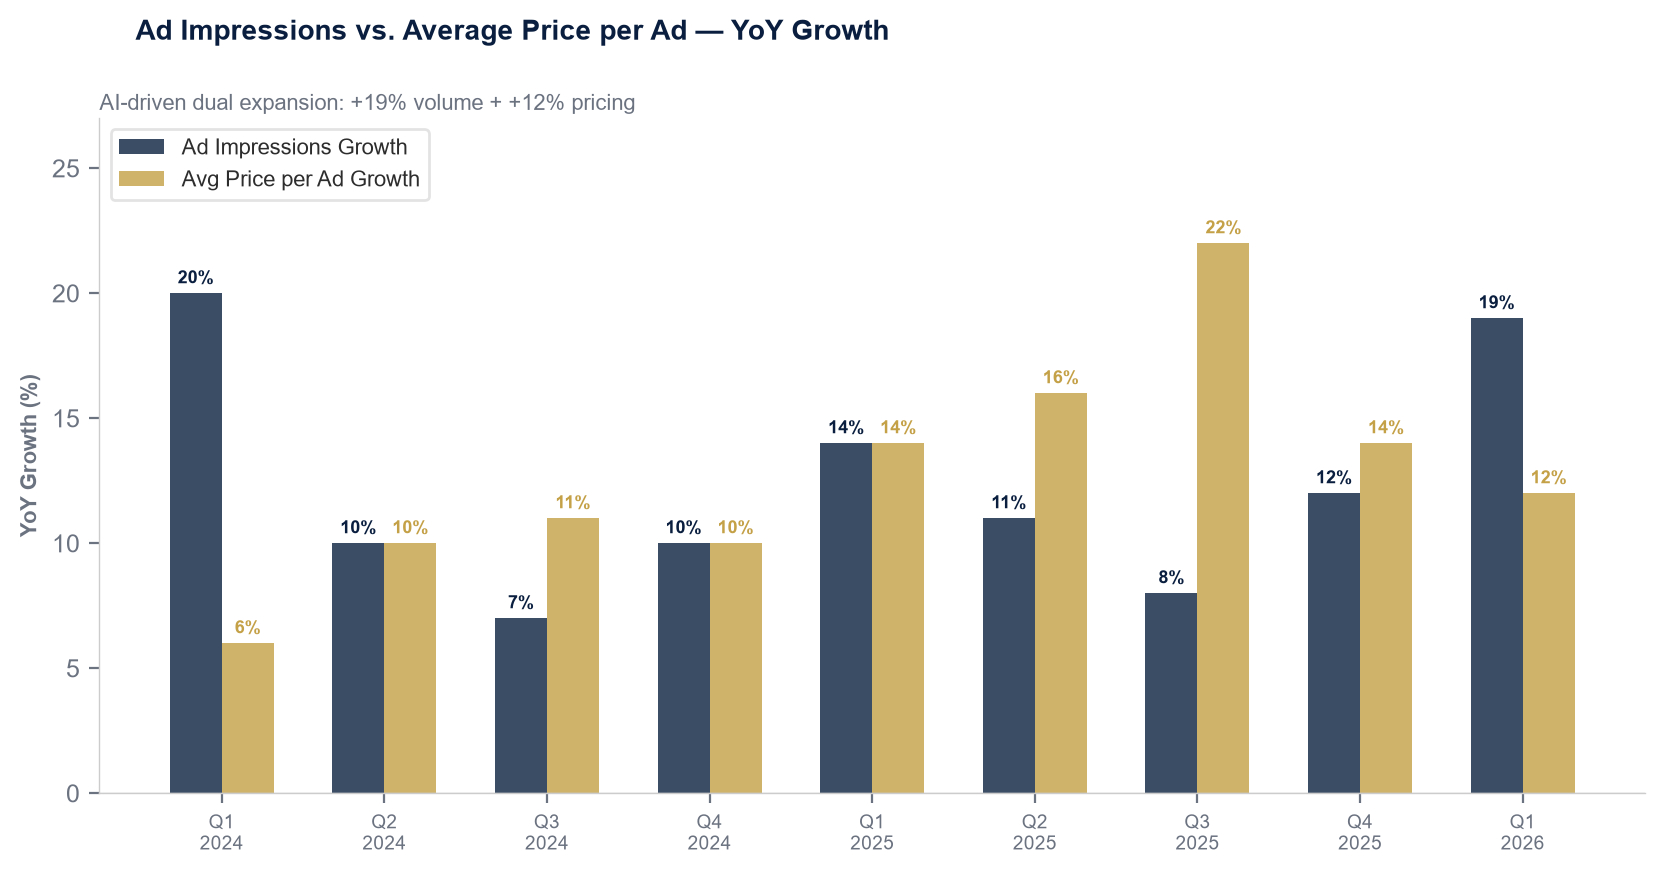
Meta Platforms delivered its strongest quarterly revenue growth since the iOS ATT era began, with total revenue surging +33% YoY to $56.31 billion, handily beating the $55.5B consensus. Advertising revenue grew at the same +33% clip, powered by a virtuous combination of +19% ad impression growth and +12% average price per ad increase. Family of Apps operating margin hit 48.1%, the highest among mega-cap tech.
What Drove the After-Hours Sell-Off
- Capex guidance raised to $125–145B (from $115–135B), with multi-year contract commitments surging +$107B in a single quarter — locking Meta into elevated spend through 2027.
- No 2027 capex guidance provided — CFO Susan Li explicitly declined to constrain future spending while signaling “continued underestimation of compute needs.”
- Meta AI monetization timeline remains opaque — “scale first, monetize later” refrain disappointed investors seeking a faster path to consumer AI revenue.
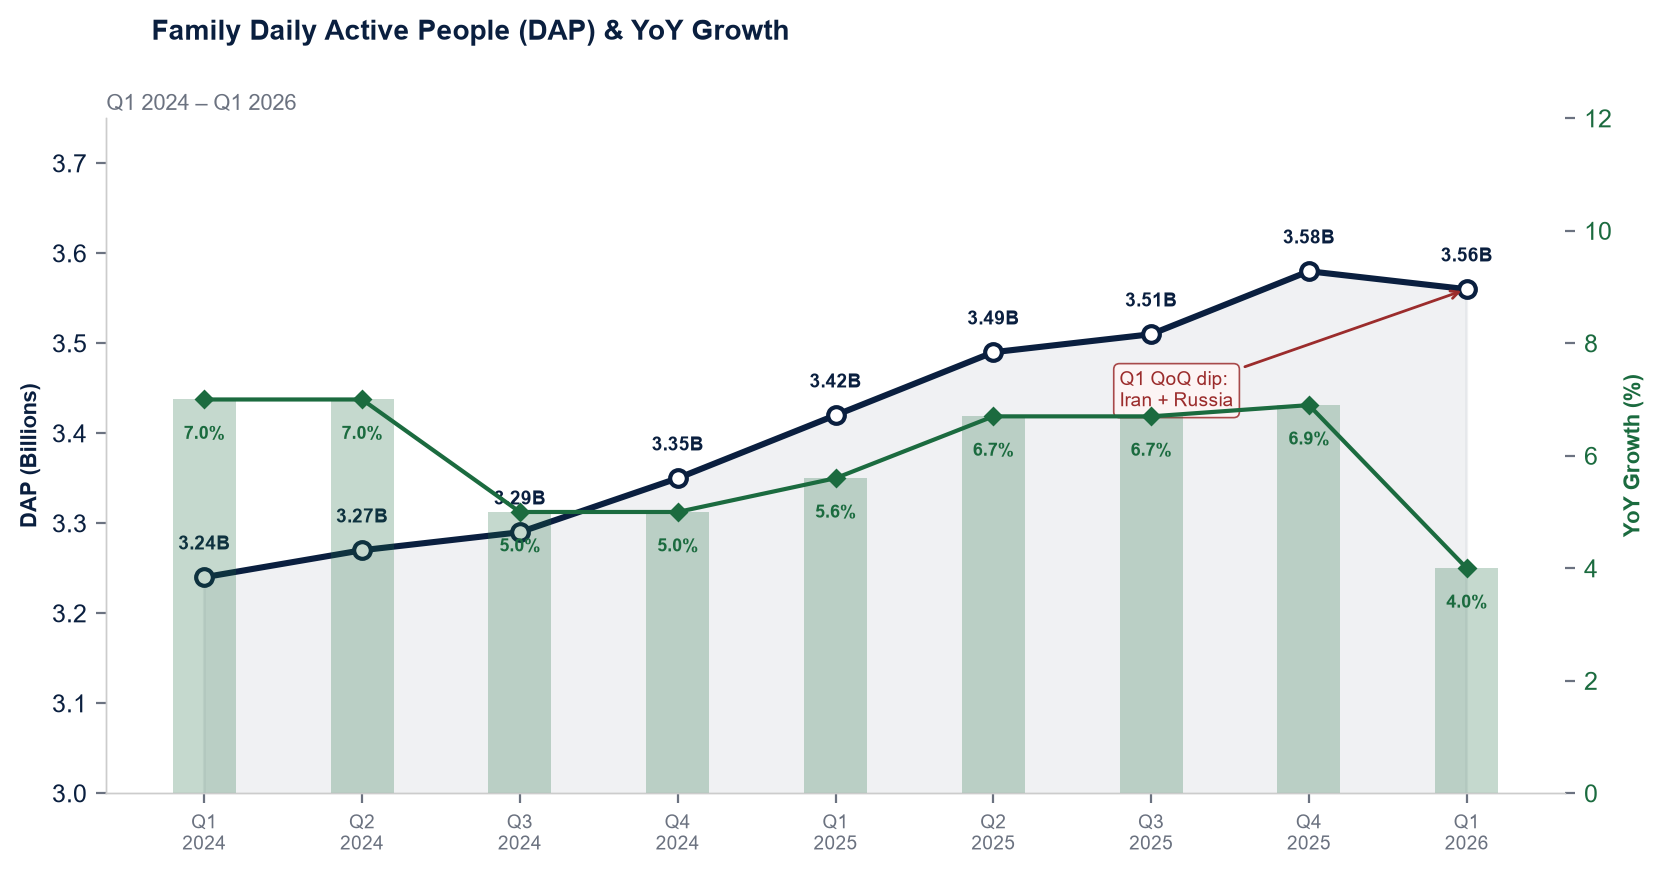
- DAP sequential decline (3.56B vs. 3.58B in Q4 2025) due to Iran/Russia disruptions, adding caution on user growth ceiling.
| Metric | Q1 2026 | Q1 2025 | YoY Change |
|---|---|---|---|
| Total Revenue | $56,311M | $42,314M | +33% |
| Advertising Revenue | $55,024M | $41,392M | +33% |
| Other Revenue (FoA) | $885M | $510M | +74% |
| Reality Labs Revenue | $402M | $412M | -2% |
| Revenue (constant currency) | — | — | +29% |
| FX Impact | +$1,749M | — | Tailwind |
Ad Impression Growth
Impressions grew +19% YoY, accelerating from +12% in Q4 2025. AI-powered content recommendations improved feed relevance across Facebook, Instagram, and Reels. Video engagement hit record highs on both core platforms.
Average Price per Ad
Pricing increased +12% YoY, slightly decelerating from Q4’s +14% but maintaining a healthy trajectory. AI-driven Advantage+ campaigns lifted advertiser ROAS, commanding higher CPMs from performance buyers.
| Metric | Q1 2026 Actual | Consensus | Beat / Miss |
|---|---|---|---|
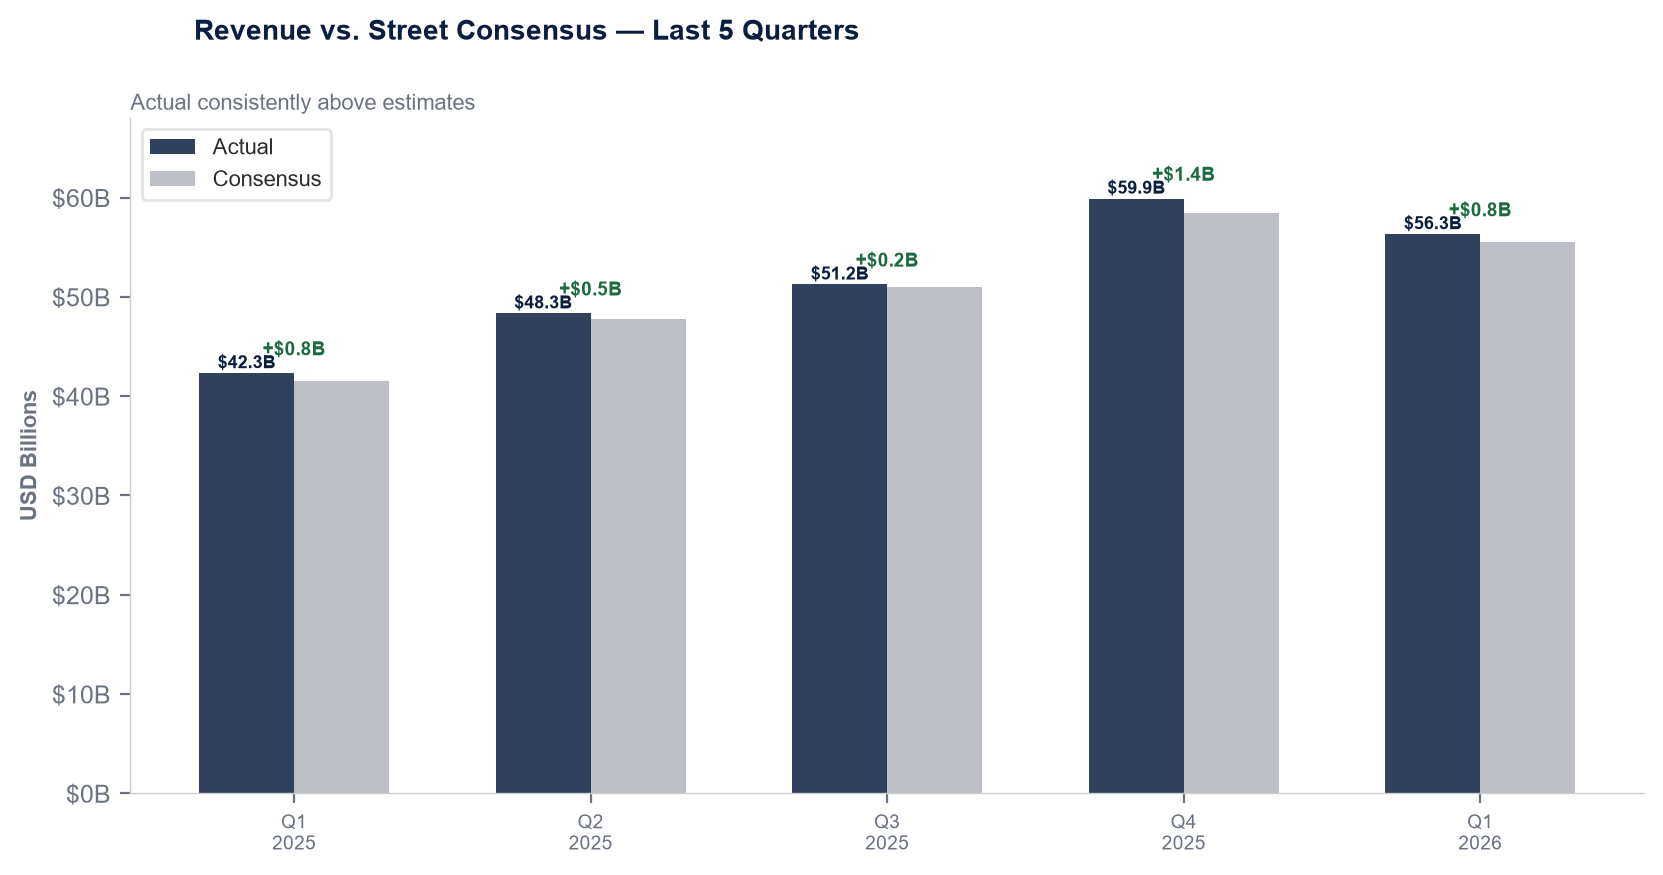
| Total Revenue | $56.31B | ~$55.5B | Beat +$0.8B |
| GAAP Diluted EPS | $10.44 | ~$6.65–$6.70 | Beat +$3.79 |
| Adjusted EPS (excl. tax benefit) | $7.31 | ~$6.70 | Beat +$0.61 |
| Operating Margin | 40.6% | ~41% | In-line |
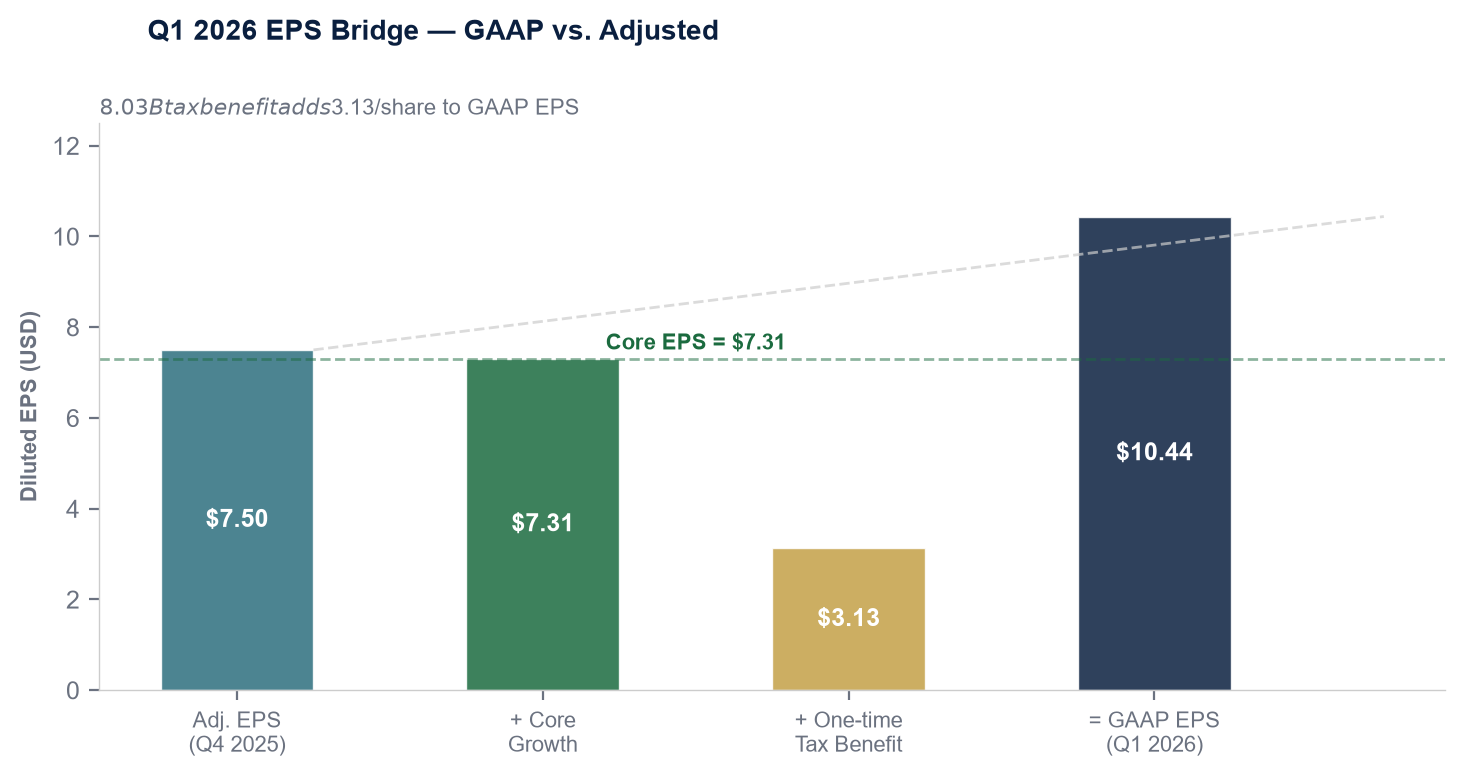
The $3.13/share gap between GAAP and adjusted EPS is entirely attributable to an $8.03B one-time tax benefit from U.S. Treasury Notice 2026-7, partially offsetting the $15.93B non-cash tax charge Meta recorded in Q3 2025 under the One Big Beautiful Bill Act. For valuation, $7.31 is the appropriate baseline.
| Metric | Q1 2026 | Q1 2025 | YoY Change |
|---|---|---|---|
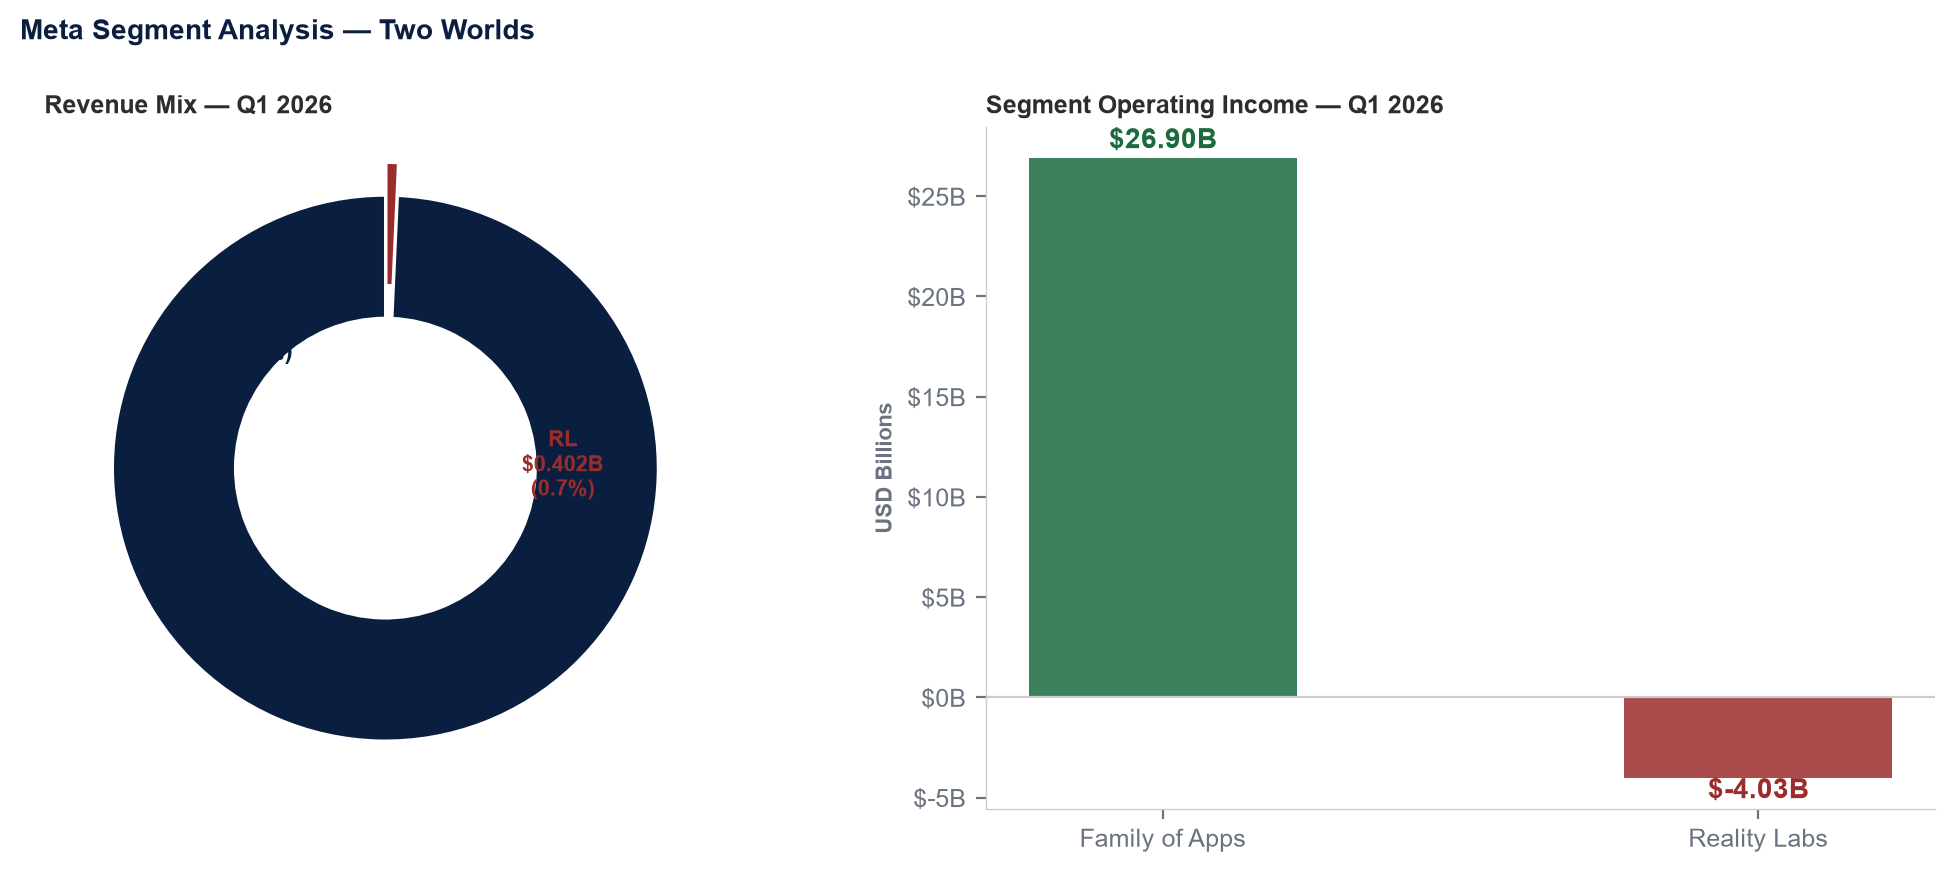
| RL Revenue | $402M | $412M | -2% |
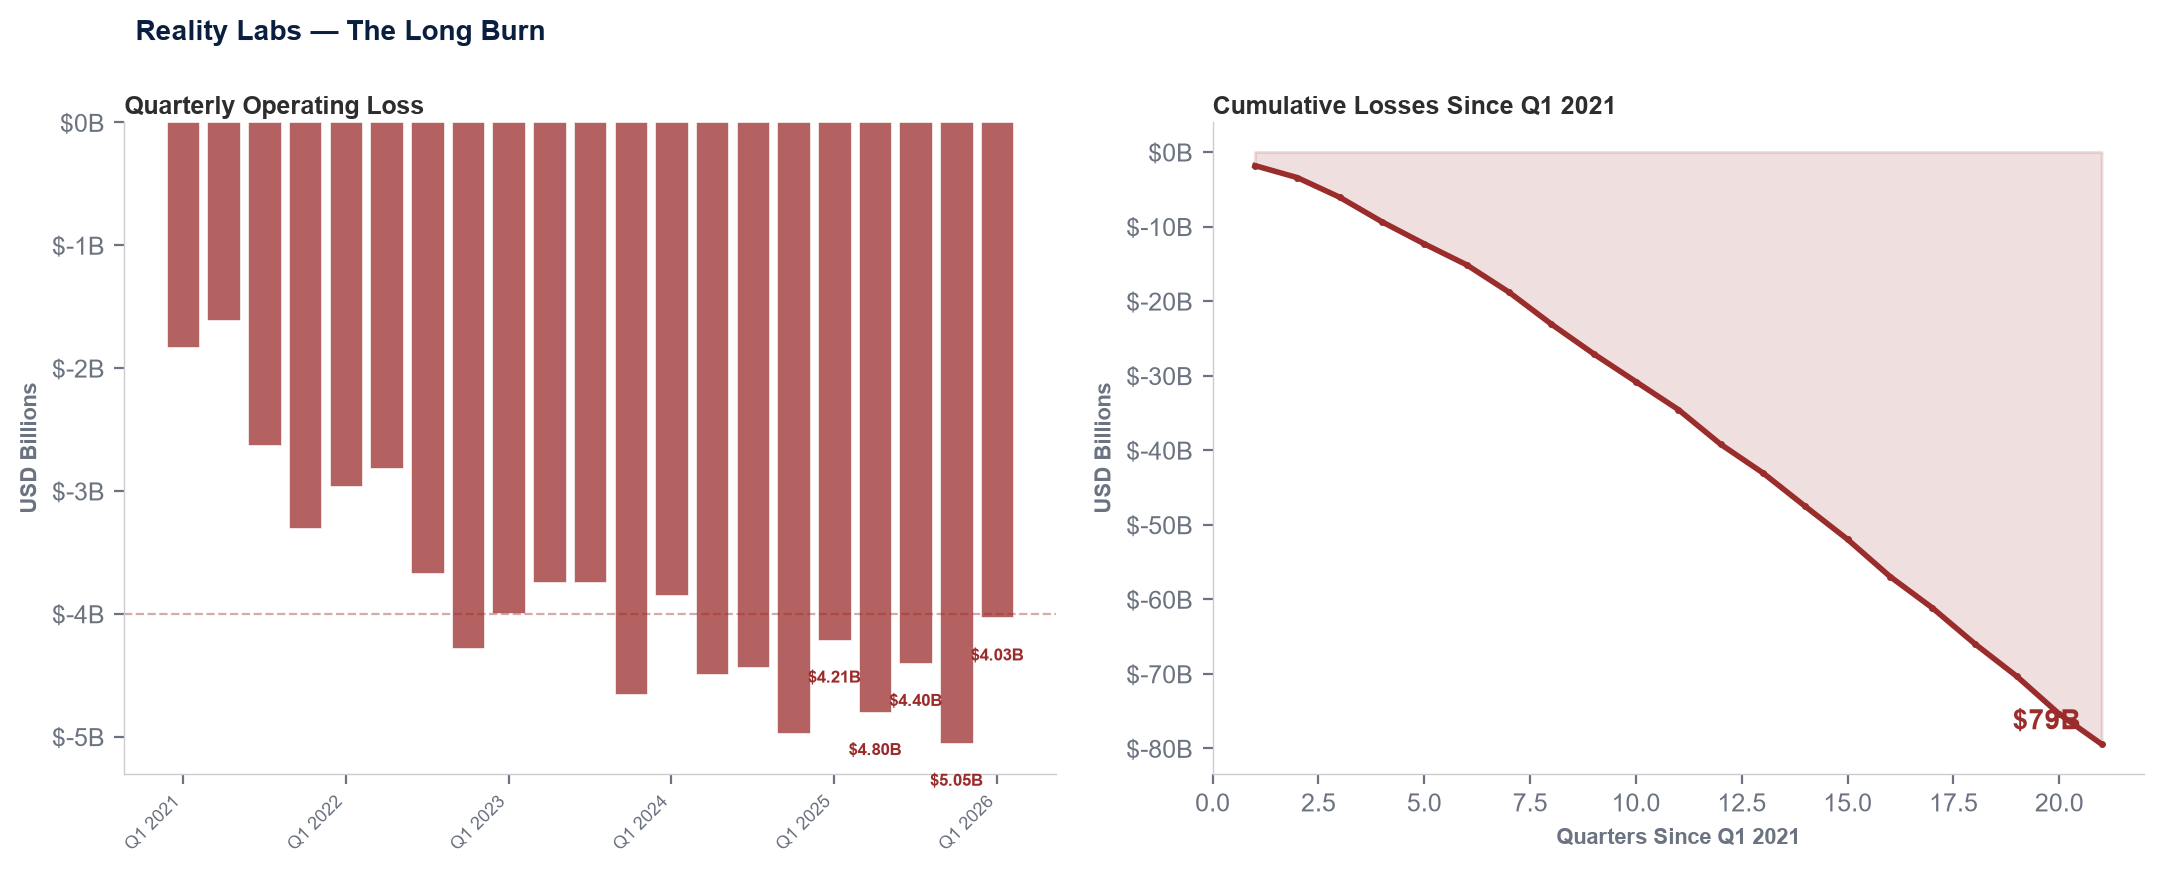
| RL Operating Loss | -$4,028M | -$4,210M | Narrowed $182M |
| Cumulative Losses (since 2020) | >$80 Billion | — | |
Product Mix Shift: VR Headsets → AI Glasses
Management attributed RL’s revenue decline to lower Quest headset sales, partially offset by strong AI glasses momentum. Zuckerberg disclosed that AI smart glasses daily active users tripled year-over-year. The Q1 2026 launch of Ray-Ban MetaOptics — an “all-day wear” device — signals a strategic pivot from VR immersion to everyday wearable computing.
Bear Case
Cumulative losses exceed $80B with quarterly burn at ~$4B. RL remains a massive drag on consolidated margins. FY2026 RL losses could reach $16–18B — erasing ~3pp from consolidated operating margin. No clear path to segment profitability.
Bull Case
AI glasses DAU tripling is the first quantifiable consumer adoption signal in RL’s history. Ray-Ban MetaOptics at scale could create a second hardware monetization engine, plus proprietary data feeding back into the ad targeting system.
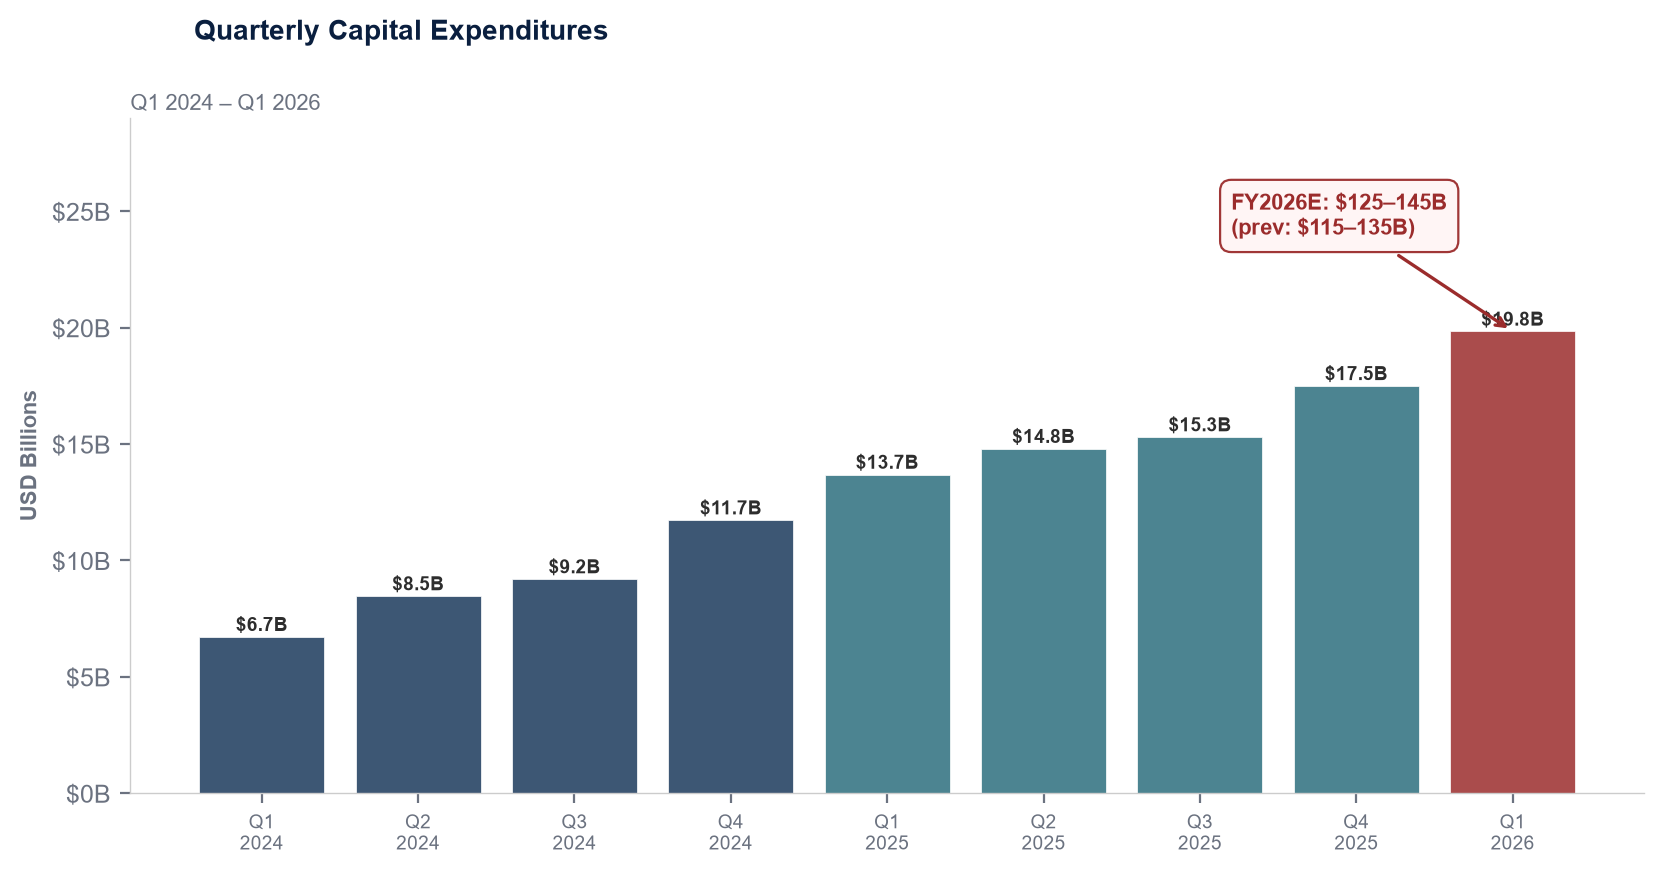
CFO Susan Li attributed the $10B increase to higher component pricing (HBM memory, DDR5, GPUs) and additional data center capacity. The component pricing driver is consistent with same-day disclosures from Microsoft and Alphabet — confirming a structural, industry-wide increase in AI infrastructure costs.
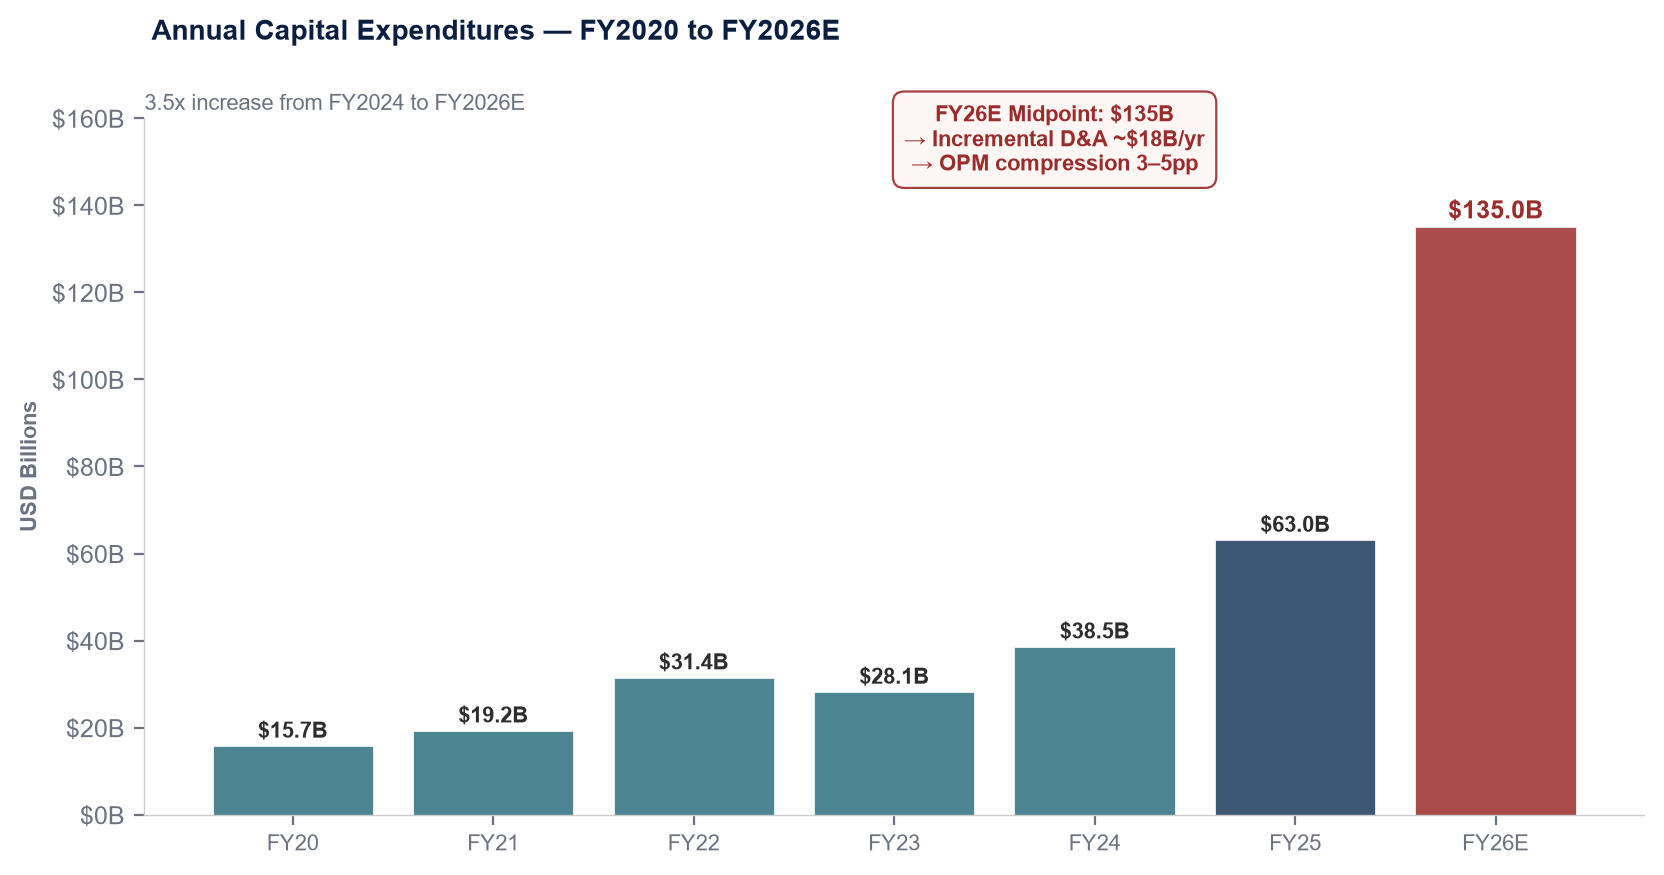
Depreciation Headwind: FY2027–FY2028
At the FY2026 midpoint of $135B, we estimate incremental annual depreciation of approximately $18B flowing through the P&L in FY2027–FY2028, compressing operating margin from ~41% to an estimated 35–37% range.
| Capex Component | Est. Allocation | Useful Life | Annual D&A Impact |
|---|---|---|---|
| Short-life (GPU/CPU/Server) | ~$90B | 6 years | ~$15B/year |
| Long-life (Data Centers) | ~$45B | 15 years | ~$3B/year |
| Total Incremental D&A | From FY2026 capex vintage | ~$18B/year | |
AI Return Spectrum
| AI Investment Area | Maturity | Revenue Impact | Q1 2026 Evidence |
|---|---|---|---|
| Ad Recommendation (Llama + Advantage+) | Proven | Direct & material | +19% impressions + +12% pricing = +33% ad revenue |
| Content Recommendation (Reels, Feed) | Proven | Indirect (engagement → impressions) | Video engagement at record highs; DAP 3.56B |
| Meta AI (Consumer Chatbot) | Early stage | Zero revenue | Sessions/user up double-digit % via Muse Spark |
| Meta Superintelligence Labs (MSL) | R&D phase | Zero revenue | First model released; research team assembled |
| Llama Open-Source Ecosystem | Strategic | Indirect (ecosystem) | Developer adoption growing; not monetized |
The Monetization Gap
The market’s frustration is clear: Meta is spending at an unprecedented rate on AI infrastructure (~$135B in FY2026), but the only material AI-driven revenue uplift is from ad improvements — which were already Meta’s core competency. Consumer AI products (Meta AI chatbot, Llama API, AI Studio) have no disclosed revenue contribution and no articulated monetization timeline.
| Metric | Q1 2026 | Q4 2025 | QoQ | YoY |
|---|---|---|---|---|
| Family DAP (March avg.) | 3.56B | 3.58B | -0.6% | +4% |
| Ad Impressions Growth | +19% | +12% | Accelerating | — |
| Avg. Price per Ad Growth | +12% | +14% | Decelerating | — |
DAP QoQ Decline: Geopolitical, Not Structural
CFO Susan Li attributed the sequential decline to Iran internet disruptions and Russia’s WhatsApp access restrictions. These are external events, not competitive losses. However, unless the geopolitical situation reverses, these users are unlikely to return — representing structural user losses in those regions.
Engagement Deepening
While absolute user growth approaches the global internet population ceiling (~5B), Meta is successfully deepening engagement per user: video consumption at record highs on Facebook and Instagram, Threads continues to scale (300M+ MAU estimated), and Meta AI chatbot usage is growing double-digits per user.
ARPU Growth Path
With DAP growth structurally capped at 4–5% YoY, future revenue growth must come from ARPU expansion. The +12% ad pricing growth suggests AI-powered targeting is effectively monetizing existing users more intensively. Geographic ARPU convergence provides additional runway.
Unmonetized Billions
Threads (300M+ MAU), Meta AI, and WhatsApp Business collectively represent tens of billions in untapped revenue potential not yet reflected in the financials. Monetization of these platforms — whenever it begins — would provide a significant incremental revenue stream.
| Line Item | Q1 2026 | Q1 2025 | YoY |
|---|---|---|---|
| Total Revenue | $56,311M | $42,314M | +33% |
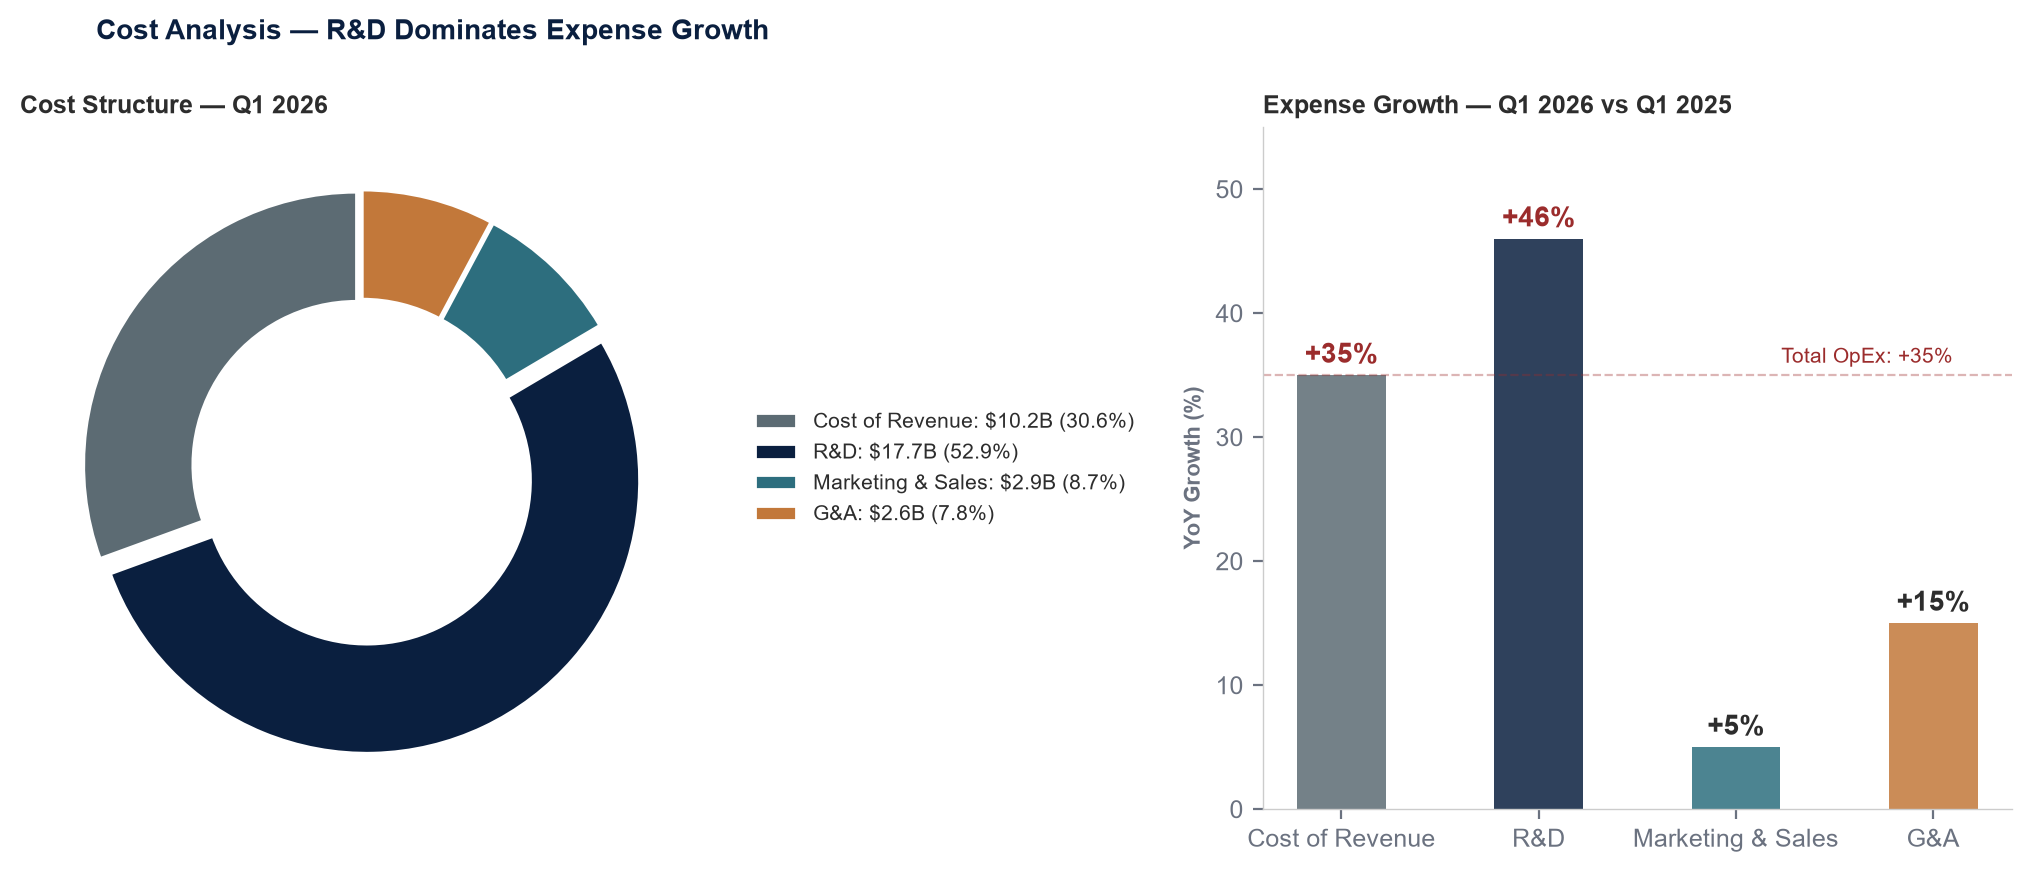
| Cost of Revenue | $10,218M | $7,572M | +35% |
| R&D Expense | $17,699M | $12,150M | +46% |
| Marketing & Sales | $2,908M | $2,757M | +5% |
| G&A | $2,614M | $2,280M | +15% |
| Total OpEx | $33,439M | $24,759M | +35% |
| Operating Income | $22,872M | $17,555M | +30% |
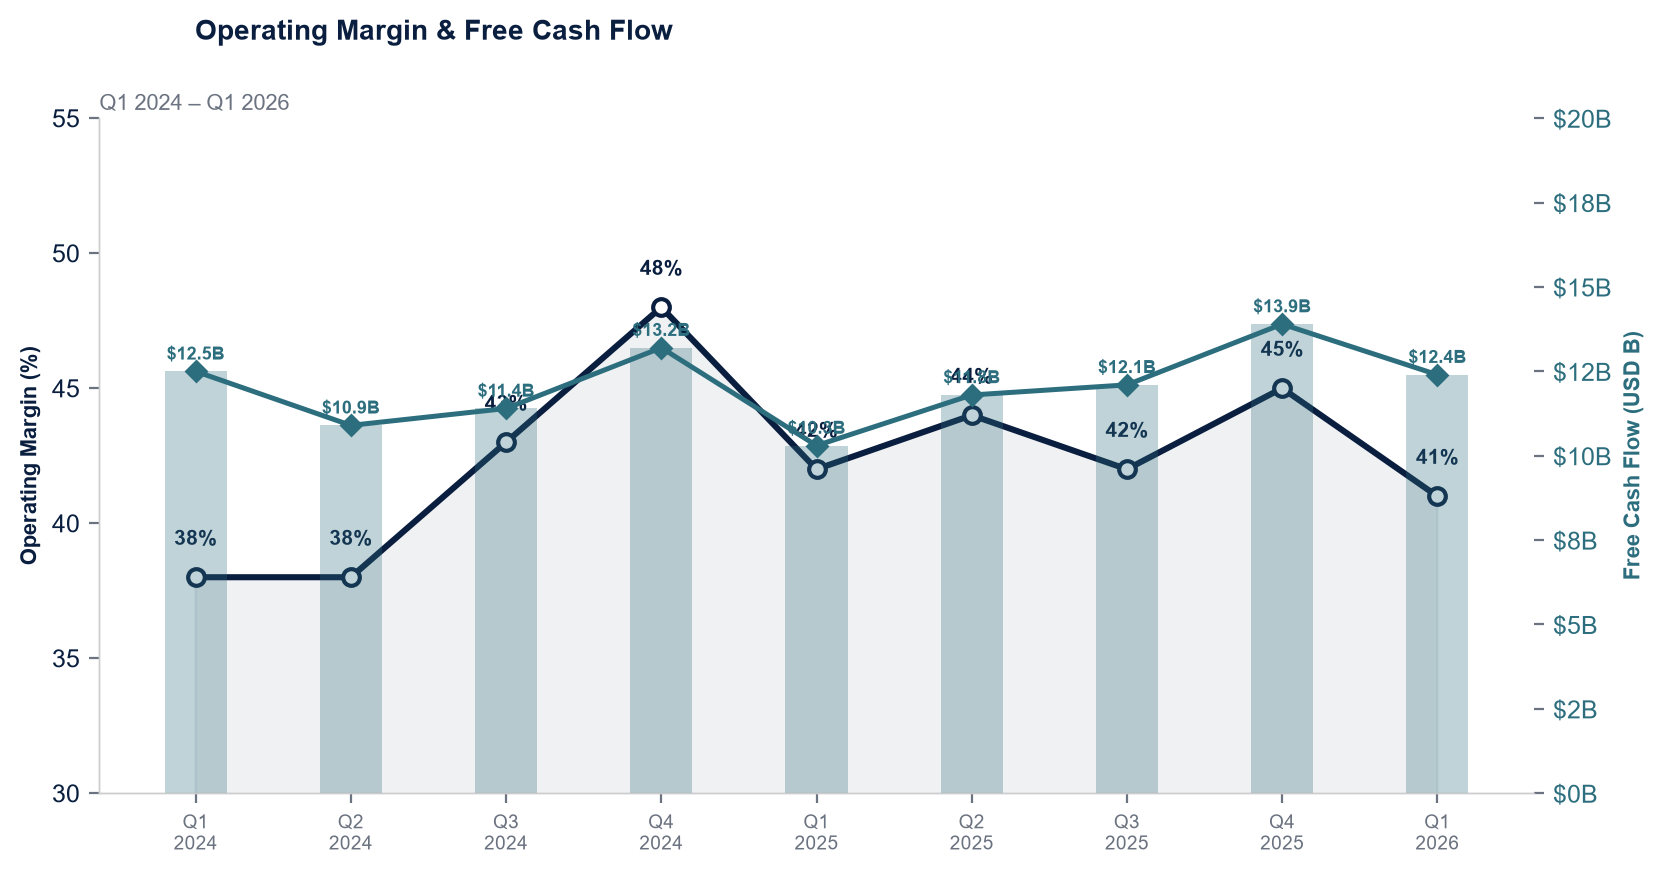
| Operating Margin | 40.6% | 41.5% | -0.9pp |
| Net Income (GAAP) | $26,773M | $16,644M | +61% |
Q2 2026 Guidance
| Metric | Guidance | Implied YoY |
|---|---|---|
| Total Revenue | $58B – $61B | +21% to +27% |
| FX Impact | ~+2pp tailwind | — |
| Revenue (constant currency) | — | ~+19% to +25% |
Full-Year 2026 Guidance
| Metric | Current | Prior | Change |
|---|---|---|---|
| Total Expenses | $162B – $169B | $162B – $169B | Unchanged |
| Capital Expenditures | $125B – $145B | $115B – $135B | +$10B |
| Effective Tax Rate (rest of FY) | 13% – 16% | — | Excl. one-time items |
Q2 Revenue Deceleration: Normalizing, Not Alarming
The Q2 guide midpoint of $59.5B implies ~+24% YoY growth, decelerating from Q1’s +33%. This is consistent with tougher comps, moderating FX tailwinds, and natural sequential patterns. We view the guide as solid, not spectacular.
The 2027 Capex Question
The single biggest valuation uncertainty is FY2027 capital expenditure. CFO Susan Li declined to provide guidance but acknowledged “continued underestimation of compute needs.” Combined with $107B in single-quarter contract commitments extending into 2027, the evidence suggests FY2027 capex stays at $130B+. FY2027 is the pivotal year for the AI ROI thesis: if ad revenue sustains 20%+ while absorbing incremental D&A, multiples can expand; if not, margin compression becomes acute.
Bull Case
- Unmatched Monetization Engine: FoA segment OPM of 48.1% is the highest in mega-cap tech. Every incremental ad dollar flows at exceptional margins.
- 3.56B DAP Moat: The world’s largest private attention marketplace, with no close competitor in scale — a non-replicable asset.
- AI Ad Flywheel is Real: +19% impressions + +12% pricing = AI lifts both dimensions of monetization simultaneously.
- AI Glasses: Second Engine Emerging: DAU tripling YoY signals potential new hardware revenue stream and data source for the ad platform.
- Unmonetized Assets: Threads (300M+ MAU), Meta AI, WhatsApp Business collectively represent tens of billions in untapped revenue.
Bear Case
- $135B Capex with No Clear ROI Timeline: AI infrastructure spending at unprecedented levels, but consumer AI revenue is entirely speculative.
- Depreciation Tsunami (FY27–FY28): ~$18B/year incremental D&A compresses OPM by 3–5pp, mechanically.
- Single Revenue Stream: Unlike Microsoft (cloud + subscriptions + AI) or Alphabet (search + cloud + YouTube), Meta has one monetization gate: advertising.
- Class A Voting Structure: Capex decisions face no effective board constraint — a unique governance risk at this scale of spend.
- User Growth Saturation: At 3.56B DAP, Meta is near the global internet ceiling. Future growth must come entirely from ARPU.
Key Risks to Monitor
| Risk Factor | Severity | Q2 2026 Catalyst |
|---|---|---|
| GAAP EPS distortion from one-time tax items | Medium | Q2 tax rate normalization |
| Q2 capex ramp to $38–40B (2× Q1) | High | Q2 earnings (late July) |
| DAP structural losses in Iran/Russia | Medium | Monitor geopolitical developments |
| Meta AI monetization timeline opacity | High | Any management disclosure on revenue |
| EU/U.S. regulatory & antitrust actions | High | U.S. youth safety trials ongoing |
| Reality Labs cumulative losses >$80B | Medium | AI glasses DAU trajectory |
| Cost growth outpacing revenue growth | Medium | Q2 OpEx vs. Revenue delta |
Our View: Cautiously Constructive
Meta Q1 2026 demonstrated that the core advertising business is in exceptional health, with AI improvements driving both volume and pricing growth. The 48.1% FoA operating margin underscores the extraordinary unit economics of the ad platform. However, the capex narrative has fundamentally changed the investment calculus: $135B in annual AI infrastructure spending demands a higher burden of proof on future returns.
The stock’s post-earnings sell-off reflects the market’s unwillingness to price in AI returns that management itself won’t quantify. We see Meta as a core holding with elevated volatility — the ad business alone justifies a substantial valuation, but the capex overhang caps multiple expansion until either (a) AI monetization timelines become concrete, or (b) capex growth shows signs of leveling off. Key watchpoints for Q2 2026 earnings: revenue trajectory, actual Q2 capex, and incremental color on Meta AI monetization.
Meta delivered the best top-line growth since 2021, powered by an AI advertising flywheel that is demonstrably working. But the $135B capex cycle — and management’s refusal to constrain 2027 spending — means the AI investment thesis now dominates the narrative. Until consumer AI revenue becomes visible, the stock trades on faith as much as fundamentals.